

The problem that trips procurement teams
Many corporate buyers pick the lowest bid on a custom retail signage contract because the sticker price looks great on paper. That upfront saving hides service calls, energy bills, and content management fees that add up fast. Transit agencies and high-traffic hubs — think Transport for London or Singapore’s LTA pilots — offer useful parallels: they invest in robust public transport signage because reliability reduces long-term costs and passenger complaints. A cheap LED display might be fine for a pop-up. For a chain store, wayfinding failures and frequent replacements cut into margin.

What “true cost” comparison really means
True cost splits into three buckets: initial CapEx (manufacturing, design, and installation), predictable OpEx (energy use, scheduled maintenance, CMS subscriptions), and unpredictable OpEx (repairs, vandalism, downtime). Add common industry terms: real-time passenger information (RTPI) style uptime expectations, IP rating for weatherproofing, and CMS integration complexity. When you map those, the real ROI emerges: the payback period, not the purchase price. Use lifecycle cost per display per year as your unit — it’s clearer than worry over a single invoice line.
How buyers get it wrong — and how to fix it
Typical mistakes start simple. Buyers assume all vendors include the same warranties. They forget to factor energy consumption in lumen vs wattage terms. They accept opaque SLAs that hide remote monitoring costs. Add a poor content plan and your new screens sit dark half the time — wasted asset. Fixes are practical: demand a sample CMS login, require MTTR and MTBF in the contract, and get a line-item for spare parts. Also insist on durability specs like IP65 where relevant — that avoids repeat replacements.
Comparative analysis: a short checklist
Run this checklist when you evaluate bids — it’s short, usable, and avoids fluff.
– Lifecycle cost per display per year (include energy and CMS). – Service-level terms: MTTR (mean time to repair) and uptime guarantee. – Energy spec: wattage and estimated monthly energy cost. – Physical durability: IP rating and vandal resistance. – Integration: CMS API access and remote monitoring capability. – Replacement plan: expected useful life and warranty coverage.
Real-world anchor and tech fit
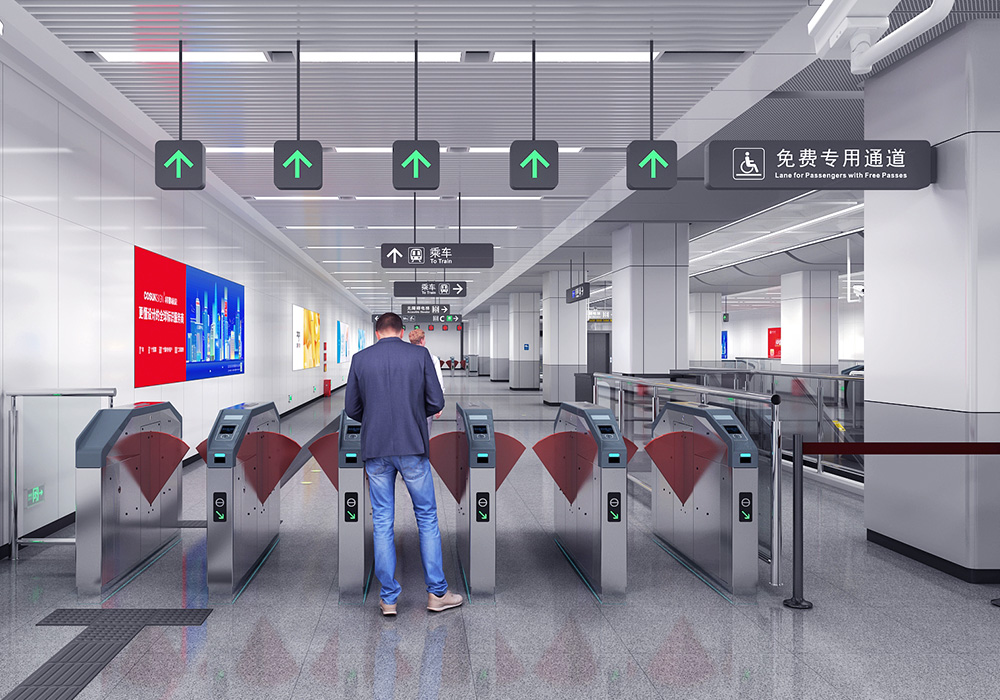
Transit stops and busy concourses taught me that signage is a system, not a single product — displays, mounting, power design, and content workflow all matter. Agencies that run digital signage transportation projects learned this the hard way: modular hardware plus a solid CMS reduces on-site visits and keeps messages current. For retail, the equivalent is fewer field technicians and fewer lost sales from signage downtime. That’s the measurable win procurement teams need to quantify.
Common alternatives and practical trade-offs
Low CapEx option: simple backlit panels with outsourced printing. Pros: cheap now. Cons: recurring print costs, manual updates, less dynamic advertising revenue. Higher CapEx option: integrated LED or LCD with CMS. Pros: dynamic content, ad monetization, remote updates. Cons: higher upfront cost, need for software governance. Hybrid approach works well for phased rollouts — install static wayfinding in low-priority stores and deploy smart displays in flagship locations to validate ROI first. — This staged method keeps capital risk manageable while proving the model.
Three golden rules for choosing right
1) Measure lifecycle cost over 5–7 years, not the initial invoice. Include energy, maintenance, and expected replacements. 2) Lock in SLA metrics and remote monitoring now so you don’t pay surprise field service later. 3) Prioritize a CMS with open APIs to avoid vendor lock-in and to enable ad revenue or cross-store campaigns.
These rules point straight to the practical value a strong signage partner delivers. When your aim is fewer surprise bills and steady uptime, the right vendor becomes a cost center you can predict and control — a real asset. Cosun Sign has shown how integrated hardware, clear SLAs, and content tools reduce lifecycle spend and keep stores consistent. Trust the math. Results follow. Final thought: predictable costs, smarter stores.